Using Data to Serve Every Single Student
How San Dieguito Union High School District pulls multiple data sources together to inform programming decisions and adjust individual student support.
At a Glance:
- Location
- Encinitas, CA
- K-12 Enrollment
- 13,000
- Teachers & Staff
- 917
Frontline Solutions Used:
- Student Analytics Lab
San Dieguito Union High School District spans 30 miles of coastline in southern California. With a 96% graduation rate, a robust CTE program, and lots of parental involvement, the district has much to be proud of. State test scores are among the highest in California, over 10,000 AP exams are given every year, and 86% of graduates attend 2- and 4-year colleges.
There are challenges, too. With five elementary districts that feed students into San Dieguito, understanding each student’s story to provide the right support can be complicated. Julie Goldberg, the Director of Assessment and Accountability, explained that not every student experiences high outcomes or has an optimal home environment. “Our challenge has always been, that’s not everybody’s story. So how do we find those students that don’t have those outcomes and provide better services and supports for them?”
Julie’s role extends beyond compliance with state assessment requirements. Leading the district’s strategic planning work, Julie oversees the development and implementation of San Dieguito’s Local Control and Accountability Plan, the district’s Title I and other federal programs, and collaborates with the finance and program departments to implement the plan.
Julie also leads data analytics work to inform the strategic planning at the district and site levels. This isn’t always easy, especially when public data sources don’t disaggregate data for student groups with few students represented. “How do we see the patterns for the groups of students that are smaller in our community? We might serve less than 10 students that are in foster care, but those needs are really high. So how do we track those kids? How do we find those kids? How do we look at outcomes for those kids in a way that we can make data-driven decisions?”
Outdated Data
In the past, most of the data the district relied on was out of date. “So much of the data we were looking at before was at the end of the semester, at the end of the school year. It was rearview mirror data. It doesn’t help me help you right now.”
If someone needed real-time data, it required an advanced skill set: writing queries, parsing large datasets, in-depth Excel knowledge, writing formulas, creating pivot tables. There were few people in the district who could do it, and that meant long wait times. Amy Springstead, a Teacher on Special Assignment for Instructional Technology, works closely with Julie and supports teachers and staff with instructional technology. “It would take me months to get the information in a usable format, and there were still issues with it.”
Datasets were difficult to correlate. This made it hard to thoughtfully develop the master schedule for kids who needed interventions. Administrators might look at teacher recommendations and perhaps class grades, but what they really wanted was to correlate universal screening data with a student’s current math or English grade. That meant pulling both of those files, merging them in Access, and crossing their fingers that the results were correct, since the process was vulnerable to human error.
There Must Be a Better Way
“There has to be a system,” Julie thought. She wanted a dashboard that would pull data from the district’s SIS, with STAR scores, AP and ELPAC assessment data, grades, attendance, and demographic information. It needed to be in real time, require minimal manual uploads, offer graphics she could paste into board presentations, and come with wraparound support to help her solve problems and talk through projects.
Julie’s mentor at the San Diego County Office of Education recommended Frontline’s Student Analytics Lab.
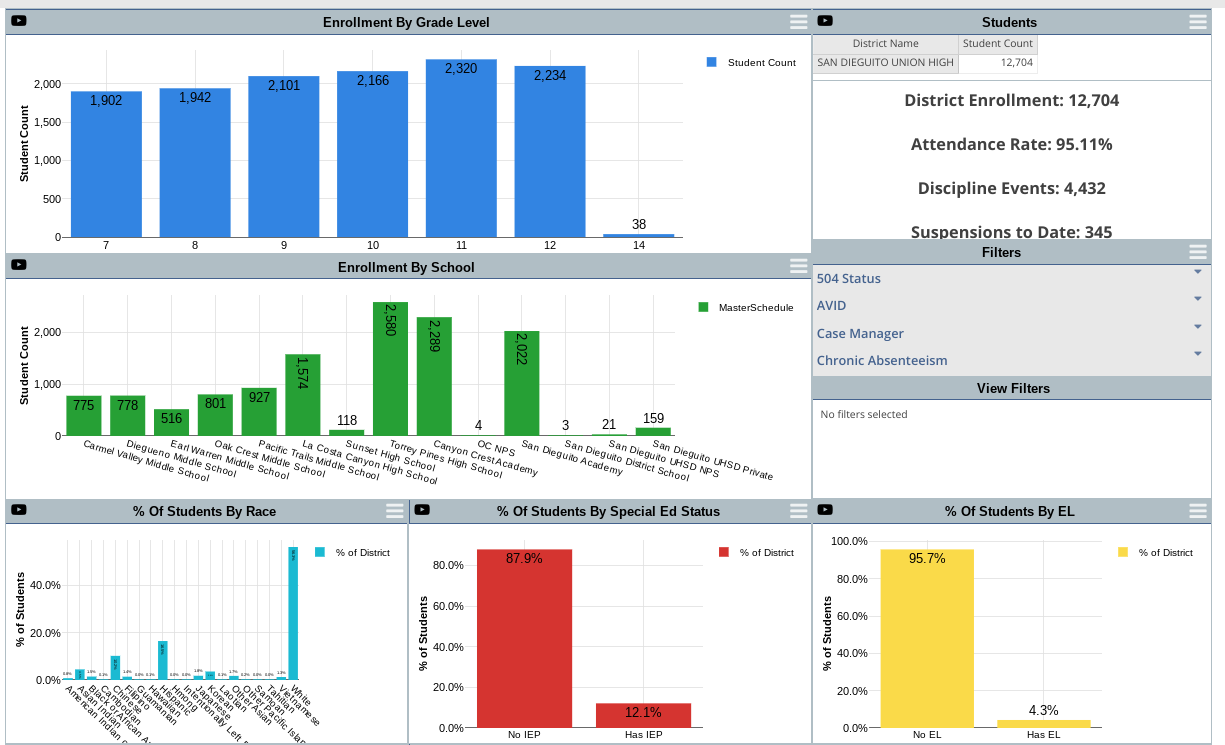
Individual Student Support
Now, Julie and Amy as well as district and campus leaders have access to real-time student data they can examine at a high level or drill down individual students. “We created a whole early warning system so we can see, of our current students, who’s in the most need of intervention now, and then what would that support planning for next year need to look like in your student schedule?”
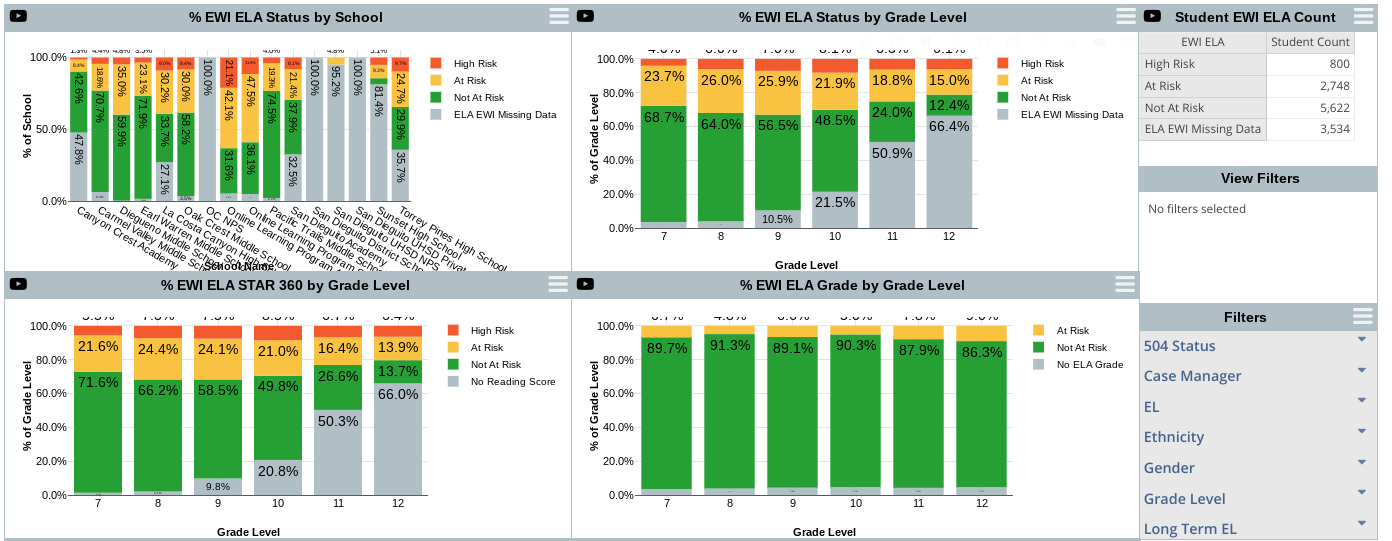
Julie helps administrators and counselors use data to determine how to provide that individual support. “When it’s time to have a Student Success Team or an IEP meeting, or revisit your annual 504 plan, we’ve continued to work on that student profile view because that gives you everything you need to know about how that student is doing, how that student is supported, and what needs to be changed to change outcomes for that student.”
This is especially valuable when looking at multiple variables for a student. “I was data coaching with one of our middle schools last week, and we were talking about how they’re supporting students who are dual identified as a student with disability and an English language learner. Before, we’d have to do a query to identify who those kids were, then look at each individual one of their schedules and see how they’re being supported. Now we can just use the filter features, look at our grade distribution table, and we can see what classes they’re sitting in and how they’re doing. It allows us to answer the hard questions without the cumbersome workflow.”
“We finally have access to data in a way that we can use and can access quickly and easily.”
“Being able to look at that at an individual level is really impactful for me to say, ‘Okay, some of our practices are not the best for all kids. They’re great for most kids, but what about all kids?’ Really making sure that we reach every kid and are doing our best to support every single student. And I feel like with the program that we have, we can do that very easily.”
Faster Decisions for In-the-Moment Support
Easier access to data means faster access to information needed to make decisions. Every year, Julie would look at math class grades to help determine how successfully students progressed from one year to the next. In the past, it would take her months to get the information she needed. Now, she has it in a usable format in one day and can work with schools to make faster decisions.
“Instead of having to wait months to say, ‘Oh, this program’s not working, we need to make a change,’” Amy said, “we notice it that much sooner and can really change things for the better for students and for teachers and what’s happening in our classrooms.”
“It shines the flashlight on where to look next. If we’re investing in targeted intervention and we’re not seeing the outcomes that are intended from targeted intervention, then that merits a deeper dive into program evaluation.”
More Informed Strategic Planning
When Julie works on the district’s strategic plan, she always begins with a macro view. What are public trends showing? What public data can be found on the California School Dashboard? “When we do strategic planning, we start big picture and then we go all the way down to where is the actionable student support, where we can change the outcome for the student, and then how do we fund that? What does that look like?”
Then she opens Student Analytics Lab to correlate those trends with non-public data from sources like their SIS. For example, she might want to dig into intervention classes at a particular school. “Why are we seeing a higher rate of D’s and F’s in those classes? Is it because the numbers are smaller? Is it the grading? Is it the grading practices? Are the instructional activities not supporting the acceleration?”
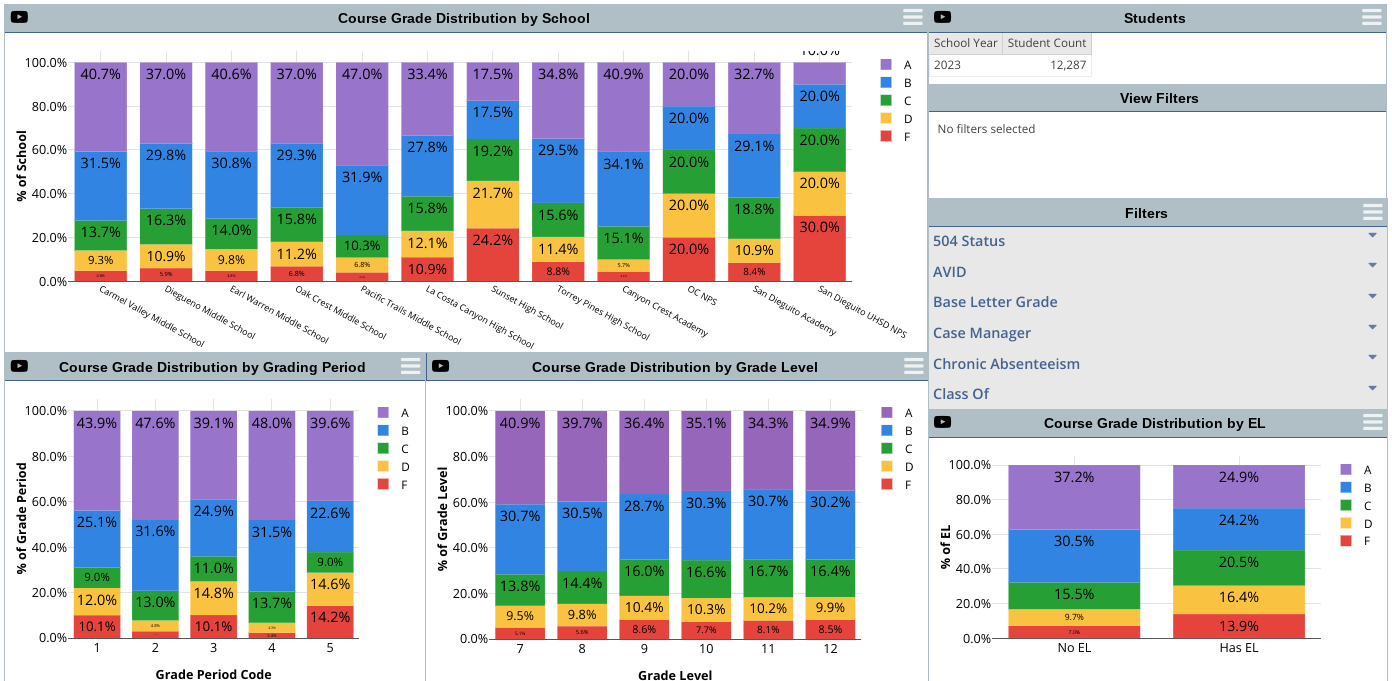
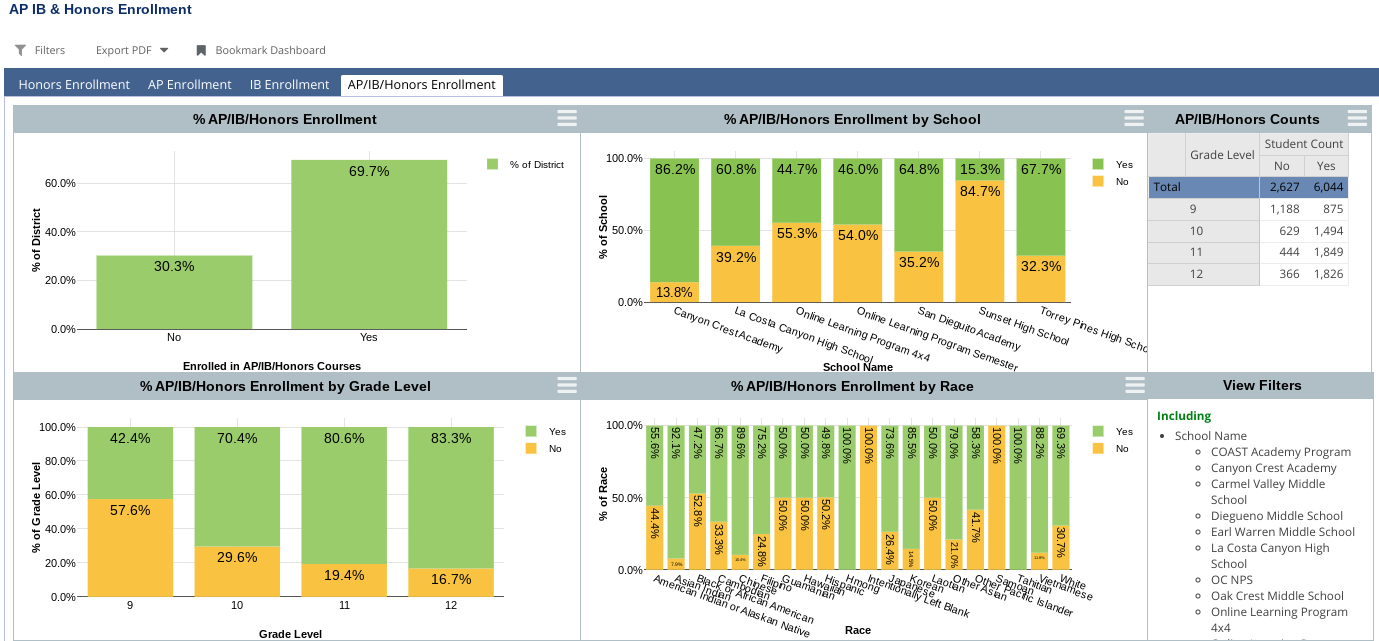
She looks at enrollment data to see what percentage of their students are taking AP and honors courses compared to college prep courses or below grade level courses — and she can see that visually over multiple years. In the past, Julie would have had to look at each school individually and manually compile it onto a spreadsheet each year. Now, she just saves the report to use again, and adjusts the filters.
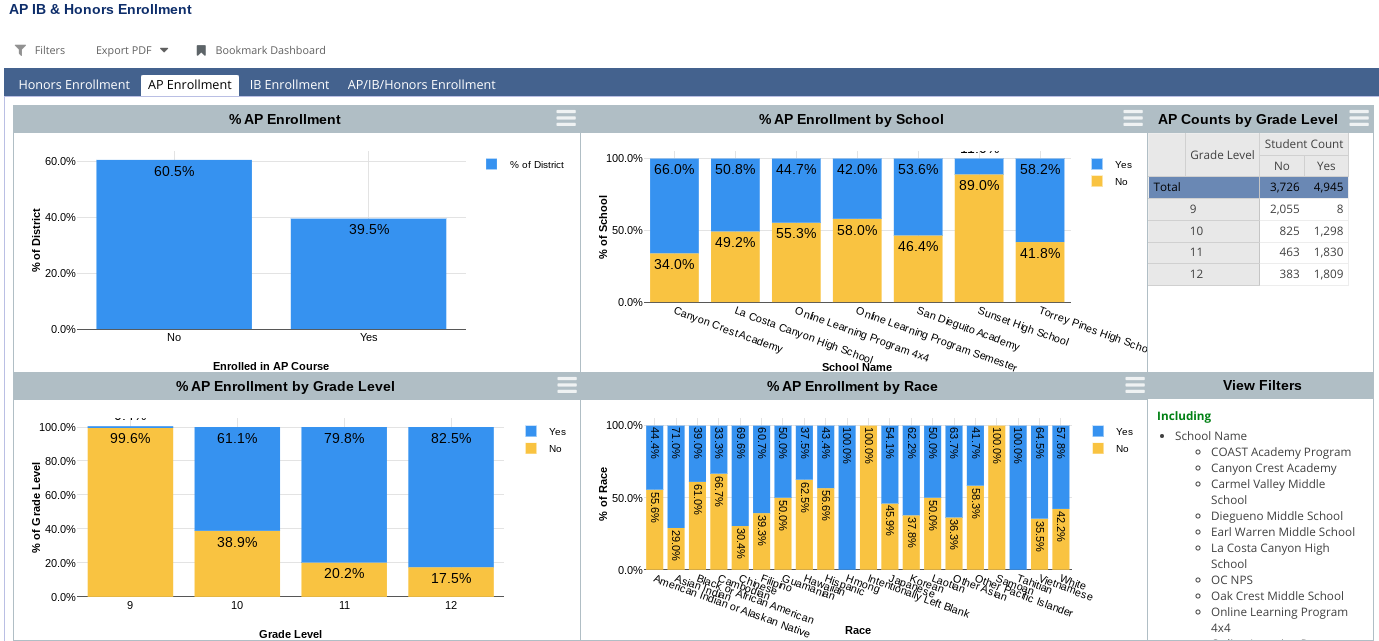
Greater Credibility
In a district where so many parents are highly involved, there is bound to be some disagreement over programming decisions. Everyone can look at publicly available data, but Julie said that being able to tell the story of a single student and their outcomes can help shift the narrative to support data-driven decisions and speak on behalf of students who might otherwise get lost or overlooked.
The Game Has Been Changed
Usage of Student Analytics Lab at San Dieguito is higher than Julie or Amy expected. Beyond their own team, principals and APs also use the system regularly to look at discipline, attendance, and course grades. Julie said they are also asking the right questions more frequently, because they can answer those questions in a timely manner, and don’t need specialized skills to use the data.
It’s helping San Dieguito lean into their reputation as a high-performing district, inform programming decisions, make quick adjustments for individual student support, and get community buy-in.
“This product does what I was hoping a product would do for years, and it has been game changing for us since we’ve adopted it.”
Data-based Decision-support Software for Schools
See how Frontline Analytics can help your district make more strategic decisions by bringing your data together into easy-to-understand visual dashboards — and communicate your vision to your board, stakeholders, and community.